| SPENDING CATEGORY |
FY2014
Expended |
FY2015
Expended |
FY2016
Expended |
FY2017
Projected Spending |
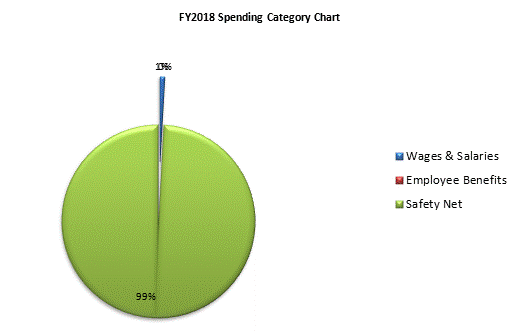
FY2018
House 1 |
|---|---|---|---|---|---|
| Wages & Salaries | 236 | 238 | 165 | 186 | 244 |
| Employee Benefits | 5 | 6 | 5 | 6 | 6 |
| Operating Expenses | 114 | 112 | 0 | 0 | 0 |
| Safety Net | 21,582 | 22,406 | 23,063 | 27,857 | 28,959 |
| TOTAL | 21,937 | 22,762 | 23,232 | 28,048 | 29,208 |
