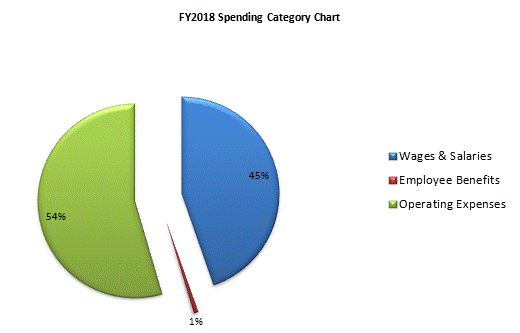
| SPENDING CATEGORY |
FY2014
Expended |
FY2015
Expended |
FY2016
Expended |
FY2017
Projected Spending |
FY2018
House 1 |
|---|---|---|---|---|---|
| Wages & Salaries | 2,633 | 2,676 | 2,749 | 3,142 | 2,950 |
| Employee Benefits | 76 | 80 | 79 | 90 | 49 |
| Operating Expenses | 738 | 844 | 264 | 3,368 | 3,600 |
| TOTAL | 3,447 | 3,600 | 3,092 | 6,600 | 6,600 |