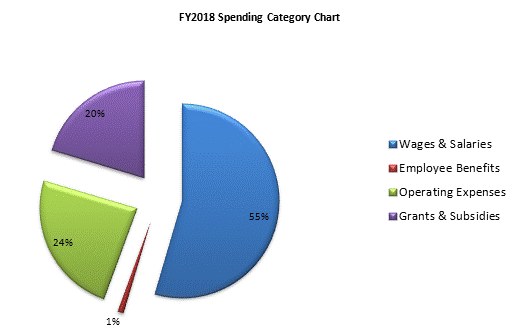
| SPENDING CATEGORY |
FY2014
Expended |
FY2015
Expended |
FY2016
Expended |
FY2017
Projected Spending |
FY2018
House 1 |
|---|---|---|---|---|---|
| Wages & Salaries | 8,845 | 9,258 | 10,328 | 11,454 | 11,813 |
| Employee Benefits | 137 | 159 | 191 | 215 | 217 |
| Operating Expenses | 3,065 | 3,964 | 3,631 | 4,605 | 5,211 |
| Grants & Subsidies | 6,216 | 5,668 | 7,917 | 8,035 | 4,411 |
| TOTAL | 18,263 | 19,049 | 22,067 | 24,308 | 21,652 |
