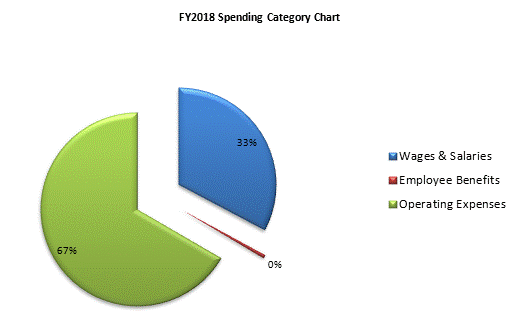
| SPENDING CATEGORY |
FY2014
Expended |
FY2015
Expended |
FY2016
Expended |
FY2017
Projected Spending |
FY2018
House 1 |
|---|---|---|---|---|---|
| Wages & Salaries | 5,715 | 6,332 | 5,954 | 6,039 | 6,112 |
| Employee Benefits | 97 | 110 | 103 | 109 | 109 |
| Operating Expenses | 9,655 | 10,454 | 11,525 | 11,421 | 12,421 |
| TOTAL | 15,467 | 16,895 | 17,582 | 17,569 | 18,642 |