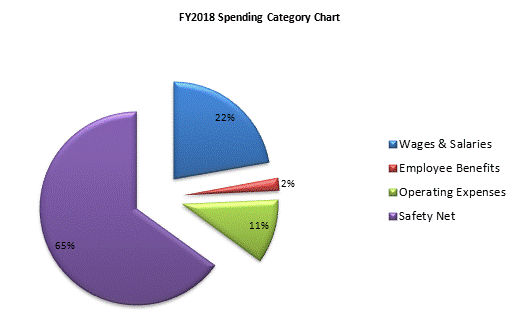
| SPENDING CATEGORY |
FY2014
Expended |
FY2015
Expended |
FY2016
Expended |
FY2017
Projected Spending |
FY2018
House 1 |
|---|---|---|---|---|---|
| Wages & Salaries | 22,832 | 24,266 | 24,199 | 25,831 | 26,697 |
| Employee Benefits | 1,817 | 1,702 | 2,866 | 2,436 | 2,447 |
| Operating Expenses | 12,005 | 11,145 | 10,954 | 12,497 | 12,830 |
| Safety Net | 70,749 | 75,025 | 74,601 | 74,362 | 78,013 |
| TOTAL | 107,404 | 112,138 | 112,619 | 115,127 | 119,987 |
