| SPENDING CATEGORY |
FY2014
Expended |
FY2015
Expended |
FY2016
Expended |
FY2017
Projected Spending |
FY2018
House 1 |
|---|---|---|---|---|---|
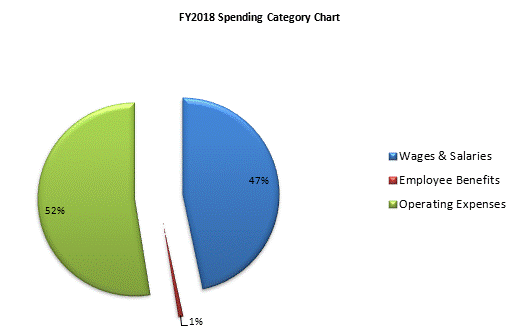
| Wages & Salaries | 11,797 | 14,750 | 14,887 | 14,335 | 12,899 |
| Employee Benefits | 152 | 215 | 261 | 259 | 217 |
| Operating Expenses | 10,180 | 9,721 | 9,550 | 13,037 | 14,515 |
| TOTAL | 22,129 | 24,686 | 24,699 | 27,631 | 27,631 |
