| SPENDING CATEGORY |
FY2014
Expended |
FY2015
Expended |
FY2016
Expended |
FY2017
Projected Spending |
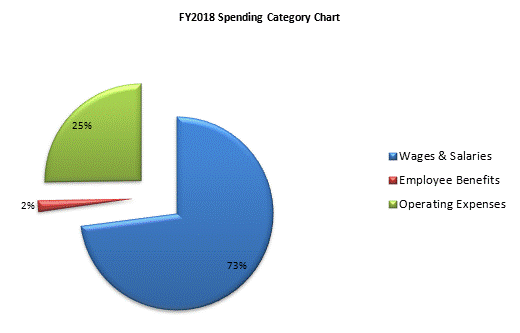
FY2018
House 1 |
|---|---|---|---|---|---|
| Wages & Salaries | 6,573 | 6,694 | 7,045 | 7,346 | 7,544 |
| Employee Benefits | 190 | 215 | 200 | 187 | 188 |
| Operating Expenses | 1,894 | 2,086 | 2,456 | 2,540 | 2,609 |
| TOTAL | 8,657 | 8,996 | 9,700 | 10,073 | 10,342 |
