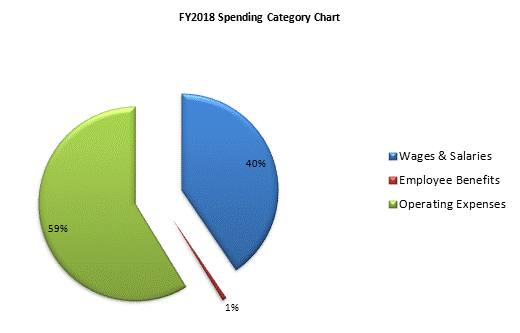
| SPENDING CATEGORY |
FY2014
Expended |
FY2015
Expended |
FY2016
Expended |
FY2017
Projected Spending |
FY2018
House 1 |
|---|---|---|---|---|---|
| Wages & Salaries | 4,596 | 4,837 | 4,227 | 4,525 | 4,427 |
| Employee Benefits | 74 | 80 | 73 | 79 | 79 |
| Operating Expenses | 5,599 | 5,352 | 6,031 | 6,375 | 6,422 |
| TOTAL | 10,269 | 10,270 | 10,332 | 10,979 | 10,928 |
