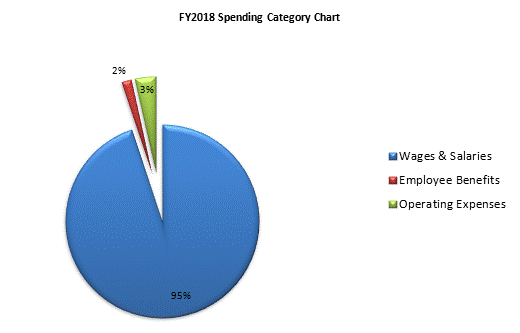
| SPENDING CATEGORY |
FY2014
Expended |
FY2015
Expended |
FY2016
Expended |
FY2017
Projected Spending |
FY2018
House 1 |
|---|---|---|---|---|---|
| Wages & Salaries | 520 | 514 | 356 | 345 | 351 |
| Employee Benefits | 8 | 9 | 6 | 6 | 6 |
| Operating Expenses | 16 | 16 | 6 | 13 | 13 |
| TOTAL | 544 | 538 | 367 | 363 | 369 |
