| SPENDING CATEGORY |
FY2014
Expended |
FY2015
Expended |
FY2016
Expended |
FY2017
Projected Spending |
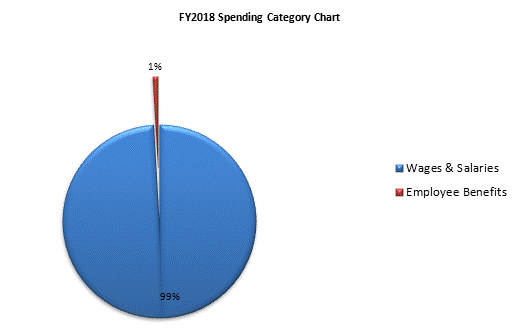
FY2018
House 1 |
|---|---|---|---|---|---|
| Wages & Salaries | 392 | 362 | 366 | 384 | 384 |
| Employee Benefits | 7 | 6 | 6 | 3 | 4 |
| Operating Expenses | 0 | 0 | 10 | 0 | 0 |
| TOTAL | 398 | 369 | 383 | 387 | 387 |
