| SPENDING CATEGORY |
FY2014
Expended |
FY2015
Expended |
FY2016
Expended |
FY2017
Projected Spending |
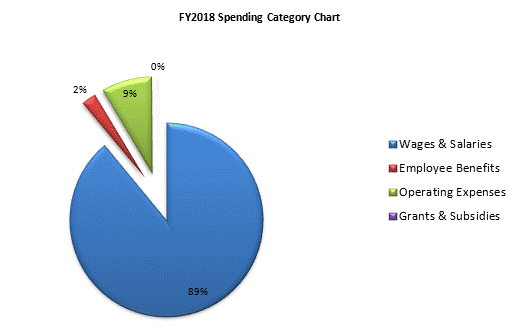
FY2018
House 1 |
|---|---|---|---|---|---|
| Wages & Salaries | 5,117 | 5,574 | 5,644 | 5,572 | 5,680 |
| Employee Benefits | 118 | 128 | 157 | 125 | 156 |
| Operating Expenses | 689 | 481 | 541 | 623 | 541 |
| Grants & Subsidies | 5 | 5 | 5 | 0 | 5 |
| TOTAL | 5,930 | 6,188 | 6,346 | 6,319 | 6,382 |
