| SPENDING CATEGORY |
FY2013 Expended |
FY2014 Expended |
FY2015 Expended |
FY2016 Projected Spending * |
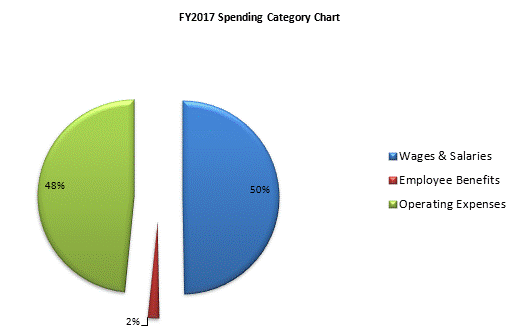
FY2017 House 2 |
|---|---|---|---|---|---|
| Wages & Salaries | 10,248 | 11,742 | 10,687 | 9,456 | 9,456 |
| Employee Benefits | 217 | 6,120 | 272 | 349 | 349 |
| Operating Expenses | 9,223 | 173,401 | 507,794 | 16,709 | 9,209 |
| Safety Net | 0 | 50,000 | 0 | 0 | 0 |
| Grants & Subsidies | 0 | 29,109 | 0 | 0 | 0 |
| TOTAL | 19,688 | 270,371 | 518,753 | 26,514 | 19,014 |
