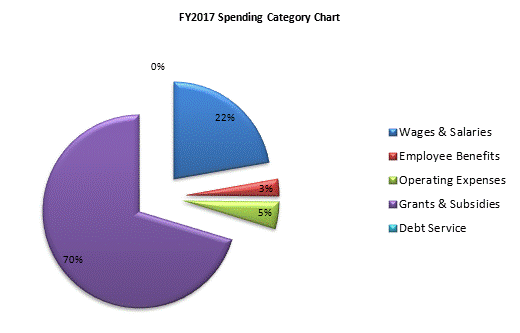
| SPENDING CATEGORY |
FY2013 Expended |
FY2014 Expended |
FY2015 Expended |
FY2016 Projected Spending * |
FY2017 House 2 |
|---|---|---|---|---|---|
| Wages & Salaries | 87,420 | 35,851 | 31,273 | 58,855 | 45,012 |
| Employee Benefits | 394 | 483 | 525 | 29,557 | 5,857 |
| Operating Expenses | 11,291 | 13,020 | 10,811 | 18,219 | 9,156 |
| Safety Net | 662,025 | 340,358 | 251 | 6,235 | 0 |
| Grants & Subsidies | 148,119 | 140,847 | 139,951 | 145,522 | 142,250 |
| Debt Service | 192 | 87 | 49 | 7,970 | 34 |
| TOTAL | 909,441 | 530,645 | 182,860 | 266,359 | 202,309 |