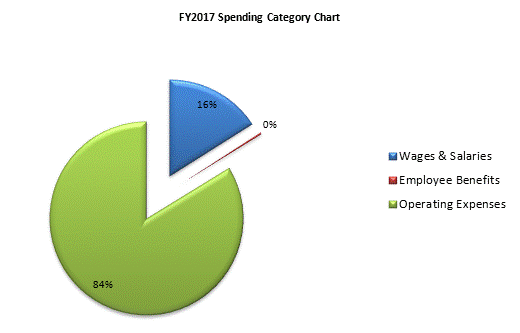
| SPENDING CATEGORY |
FY2013 Expended |
FY2014 Expended |
FY2015 Expended |
FY2016 Projected Spending * |
FY2017 House 2 |
|---|---|---|---|---|---|
| Wages & Salaries | 832 | 914 | 1,099 | 1,222 | 1,222 |
| Employee Benefits | 15 | 15 | 18 | 23 | 23 |
| Operating Expenses | 300 | 612 | 678 | 6,419 | 6,419 |
| TOTAL | 1,147 | 1,541 | 1,795 | 7,665 | 7,665 |
