1102-1128 - State House Accessibility
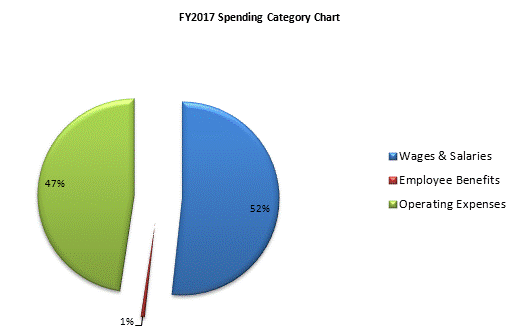
Historical Spending Categories ($000)
SPENDING CATEGORY
FY2013
Expended
FY2014
Expended
FY2015
Expended
FY2016
Projected
Spending *
FY2017
House 2
Wages & Salaries
54
65
49
74
74
Employee Benefits
1
1
1
1
1
Operating Expenses
45
59
79
68
68
TOTAL
99
125
130
142
142