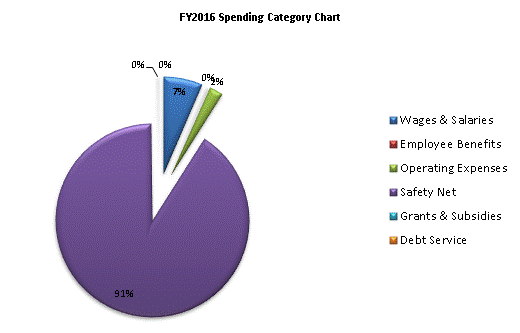
| SPENDING CATEGORY |
FY2012 Expended |
FY2013 Expended |
FY2014 Expended |
FY2015 Projected Spending * |
FY2016 House 1 |
|---|---|---|---|---|---|
| Wages & Salaries | 1,116,769 | 1,167,885 | 1,216,588 | 1,311,518 | 1,359,266 |
| Employee Benefits | 47,979 | 42,522 | 46,097 | 50,040 | 51,895 |
| Operating Expenses | 567,380 | 380,211 | 422,759 | 445,466 | 481,652 |
| Safety Net | 13,803,178 | 14,586,434 | 15,685,629 | 18,208,873 | 19,077,253 |
| Grants & Subsidies | 35,739 | 31,516 | 78,881 | 36,938 | 36,865 |
| Debt Service | 0 | 0 | 367 | 3,034 | 3,034 |
| TOTAL | 15,571,044 | 16,208,569 | 17,450,320 | 20,055,870 | 21,009,966 |
