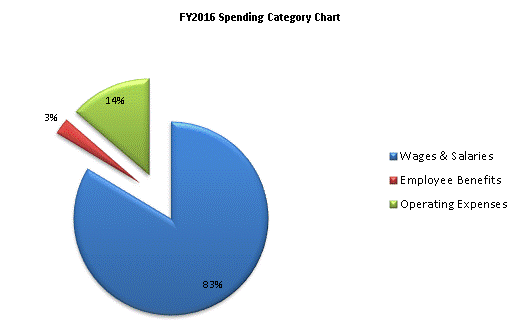
| SPENDING CATEGORY |
FY2012 Expended |
FY2013 Expended |
FY2014 Expended |
FY2015 Projected Spending * |
FY2016 House 1 |
|---|---|---|---|---|---|
| Wages & Salaries | 13,460 | 14,316 | 13,906 | 14,867 | 14,867 |
| Employee Benefits | 478 | 419 | 439 | 489 | 489 |
| Operating Expenses | 3,111 | 2,846 | 3,186 | 2,422 | 2,422 |
| TOTAL | 17,049 | 17,581 | 17,531 | 17,778 | 17,778 |
