| SPENDING CATEGORY |
FY2012 Expended |
FY2013 Expended |
FY2014 Expended |
FY2015 Projected Spending * |
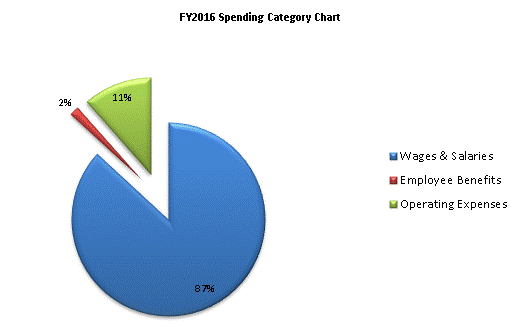
FY2016 House 1 |
|---|---|---|---|---|---|
| Wages & Salaries | 6,305 | 6,408 | 6,707 | 7,174 | 7,174 |
| Employee Benefits | 135 | 102 | 112 | 134 | 134 |
| Operating Expenses | 1,103 | 1,387 | 1,091 | 802 | 950 |
| TOTAL | 7,543 | 7,897 | 7,910 | 8,110 | 8,258 |
