| SPENDING CATEGORY |
FY2012 Expended |
FY2013 Expended |
FY2014 Expended |
FY2015 Projected Spending * |
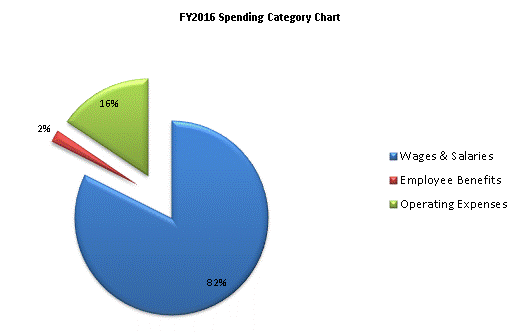
FY2016 House 1 |
|---|---|---|---|---|---|
| Wages & Salaries | 1,825 | 1,930 | 2,038 | 2,297 | 2,244 |
| Employee Benefits | 48 | 37 | 39 | 53 | 56 |
| Operating Expenses | 336 | 314 | 335 | 376 | 425 |
| TOTAL | 2,210 | 2,281 | 2,412 | 2,725 | 2,725 |
