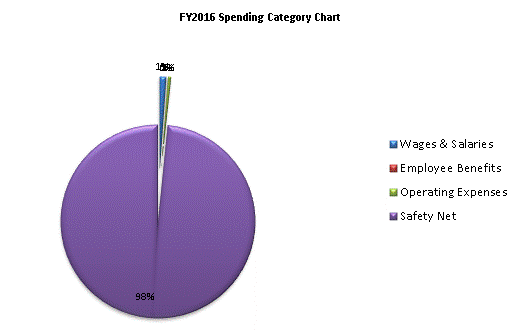
| SPENDING CATEGORY |
FY2012 Expended |
FY2013 Expended |
FY2014 Expended |
FY2015 Projected Spending * |
FY2016 House 1 |
|---|---|---|---|---|---|
| Wages & Salaries | 285 | 230 | 236 | 242 | 248 |
| Employee Benefits | 7 | 4 | 5 | 6 | 6 |
| Operating Expenses | 114 | 3 | 114 | 112 | 112 |
| Safety Net | 15,831 | 16,891 | 21,582 | 22,426 | 22,807 |
| TOTAL | 16,237 | 17,127 | 21,937 | 22,786 | 23,173 |
