| SPENDING CATEGORY |
FY2012 Expended |
FY2013 Expended |
FY2014 Expended |
FY2015 Projected Spending * |
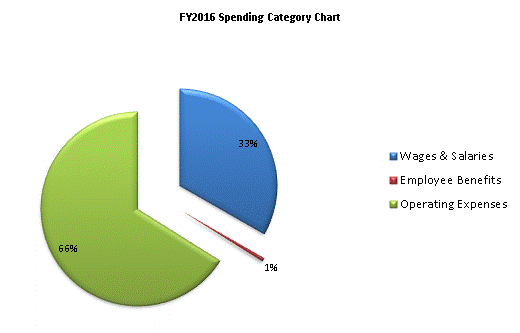
FY2016 House 1 |
|---|---|---|---|---|---|
| Wages & Salaries | 3,670 | 4,737 | 5,715 | 6,391 | 6,995 |
| Employee Benefits | 77 | 67 | 97 | 118 | 127 |
| Operating Expenses | 4,964 | 6,309 | 9,655 | 10,627 | 13,877 |
| TOTAL | 8,712 | 11,114 | 15,467 | 17,135 | 20,999 |
