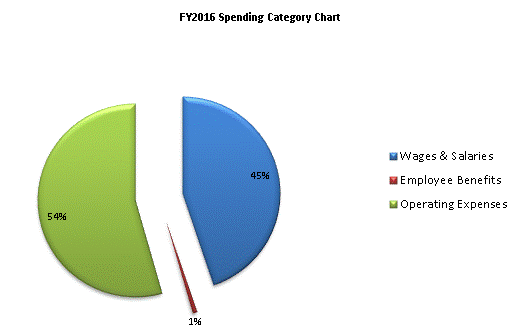
| SPENDING CATEGORY |
FY2012 Expended |
FY2013 Expended |
FY2014 Expended |
FY2015 Projected Spending * |
FY2016 House 1 |
|---|---|---|---|---|---|
| Wages & Salaries | 1,196 | 1,254 | 1,267 | 1,400 | 1,488 |
| Employee Benefits | 23 | 17 | 18 | 24 | 25 |
| Operating Expenses | 882 | 1,499 | 1,651 | 1,805 | 1,805 |
| TOTAL | 2,101 | 2,770 | 2,936 | 3,228 | 3,317 |
