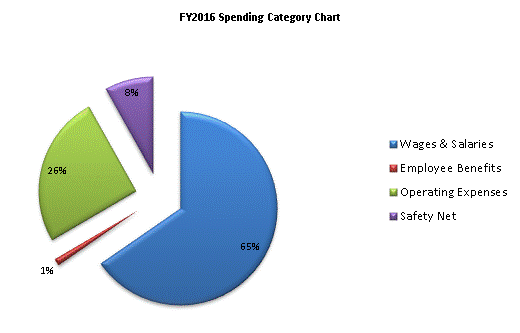
| SPENDING CATEGORY |
FY2012 Expended |
FY2013 Expended |
FY2014 Expended |
FY2015 Projected Spending * |
FY2016 House 1 |
|---|---|---|---|---|---|
| Wages & Salaries | 87,719 | 91,919 | 94,903 | 99,070 | 101,013 |
| Employee Benefits | 1,829 | 1,343 | 1,592 | 1,781 | 1,814 |
| Operating Expenses | 36,591 | 36,377 | 36,613 | 36,228 | 39,261 |
| Safety Net | 11,673 | 12,171 | 12,075 | 14,060 | 12,448 |
| TOTAL | 137,811 | 141,810 | 145,183 | 151,139 | 154,536 |
