| SPENDING CATEGORY |
FY2012 Expended |
FY2013 Expended |
FY2014 Expended |
FY2015 Projected Spending * |
FY2016 House 1 |
|---|---|---|---|---|---|
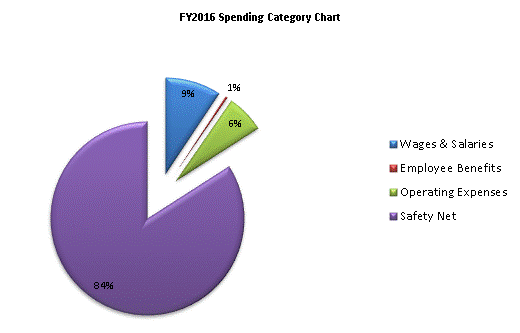
| Wages & Salaries | 132 | 141 | 139 | 153 | 161 |
| Employee Benefits | 4 | 6 | 4 | 6 | 6 |
| Operating Expenses | 96 | 101 | 106 | 110 | 110 |
| Safety Net | 1,151 | 1,151 | 1,210 | 1,760 | 1,460 |
| TOTAL | 1,383 | 1,399 | 1,458 | 2,028 | 1,736 |
