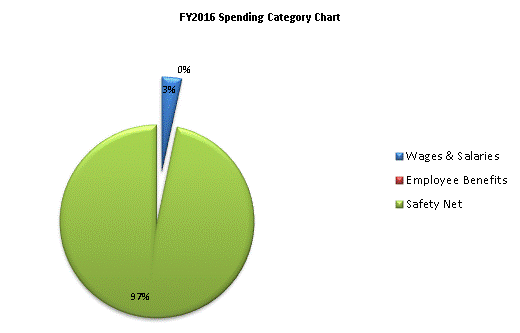
| SPENDING CATEGORY |
FY2012 Expended |
FY2013 Expended |
FY2014 Expended |
FY2015 Projected Spending * |
FY2016 House 1 |
|---|---|---|---|---|---|
| Wages & Salaries | 4,529 | 9,474 | 6,399 | 7,514 | 7,474 |
| Employee Benefits | 3 | 6 | 7 | 9 | 10 |
| Safety Net | 223,093 | 216,936 | 219,991 | 219,293 | 221,255 |
| TOTAL | 227,624 | 226,416 | 226,397 | 226,816 | 228,738 |
