| SPENDING CATEGORY |
FY2012 Expended |
FY2013 Expended |
FY2014 Expended |
FY2015 Projected Spending * |
FY2016 House 1 |
|---|---|---|---|---|---|
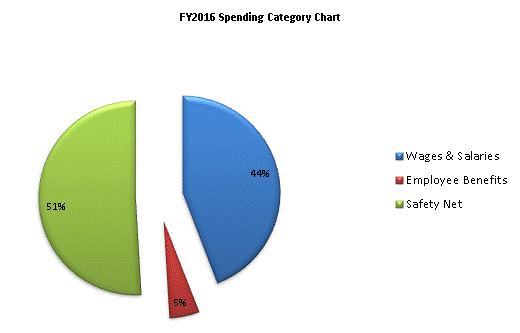
| Wages & Salaries | 9,248 | 9,661 | 10,554 | 11,252 | 11,798 |
| Employee Benefits | 460 | 804 | 890 | 1,289 | 1,298 |
| Operating Expenses | 7 | 0 | 2 | 0 | 0 |
| Safety Net | 7,753 | 9,934 | 11,362 | 13,425 | 13,592 |
| TOTAL | 17,467 | 20,400 | 22,808 | 25,966 | 26,688 |
