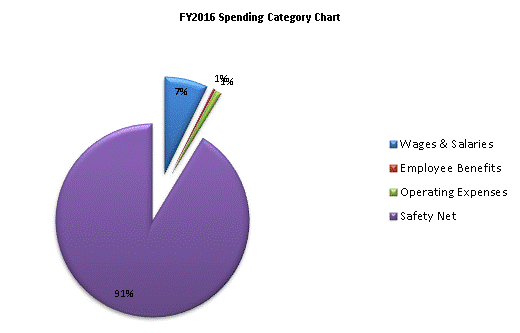
| SPENDING CATEGORY |
FY2012 Expended |
FY2013 Expended |
FY2014 Expended |
FY2015 Projected Spending * |
FY2016 House 1 |
|---|---|---|---|---|---|
| Wages & Salaries | 940 | 1,033 | 1,078 | 1,065 | 1,065 |
| Employee Benefits | 51 | 48 | 50 | 53 | 54 |
| Operating Expenses | 151 | 152 | 148 | 155 | 155 |
| Safety Net | 9,963 | 9,888 | 10,700 | 13,386 | 13,386 |
| TOTAL | 11,105 | 11,121 | 11,976 | 14,659 | 14,659 |
