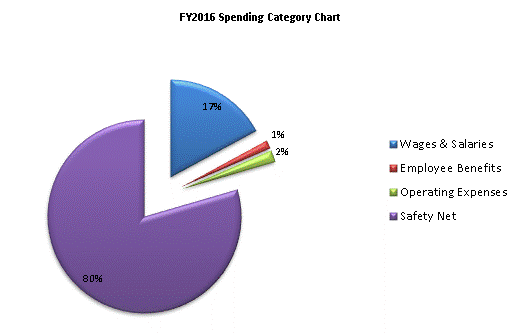
| SPENDING CATEGORY |
FY2012 Expended |
FY2013 Expended |
FY2014 Expended |
FY2015 Projected Spending * |
FY2016 House 1 |
|---|---|---|---|---|---|
| Wages & Salaries | 649 | 667 | 696 | 764 | 737 |
| Employee Benefits | 56 | 55 | 52 | 58 | 60 |
| Operating Expenses | 112 | 90 | 84 | 85 | 85 |
| Safety Net | 3,387 | 3,457 | 3,350 | 3,399 | 3,424 |
| TOTAL | 4,205 | 4,270 | 4,182 | 4,306 | 4,306 |