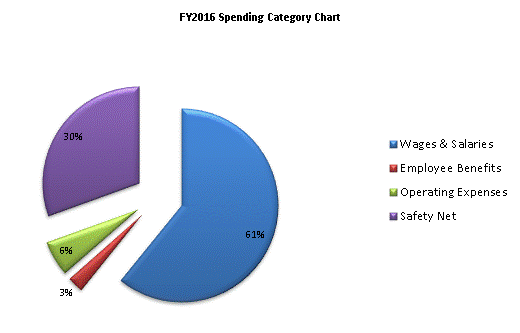
| SPENDING CATEGORY |
FY2012 Expended |
FY2013 Expended |
FY2014 Expended |
FY2015 Projected Spending * |
FY2016 House 1 |
|---|---|---|---|---|---|
| Wages & Salaries | 2,161 | 2,262 | 2,358 | 2,472 | 2,560 |
| Employee Benefits | 110 | 108 | 106 | 112 | 113 |
| Operating Expenses | 274 | 246 | 245 | 249 | 249 |
| Safety Net | 1,240 | 1,211 | 1,200 | 1,283 | 1,283 |
| TOTAL | 3,785 | 3,828 | 3,909 | 4,116 | 4,205 |
