| SPENDING CATEGORY |
FY2012 Expended |
FY2013 Expended |
FY2014 Expended |
FY2015 Projected Spending * |
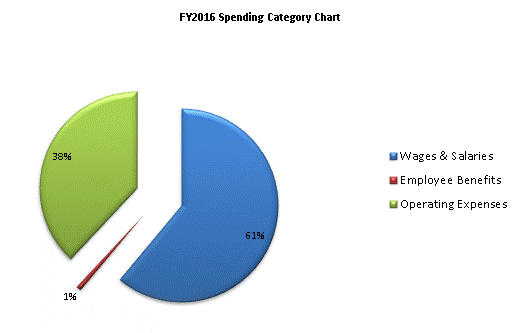
FY2016 House 1 |
|---|---|---|---|---|---|
| Wages & Salaries | 11,916 | 10,424 | 11,797 | 17,998 | 17,998 |
| Employee Benefits | 173 | 150 | 152 | 245 | 245 |
| Operating Expenses | 7,243 | 8,251 | 10,180 | 11,225 | 11,225 |
| TOTAL | 19,332 | 18,824 | 22,129 | 29,468 | 29,468 |
