| SPENDING CATEGORY |
FY2012 Expended |
FY2013 Expended |
FY2014 Expended |
FY2015 Projected Spending * |
FY2016 House 1 |
|---|---|---|---|---|---|
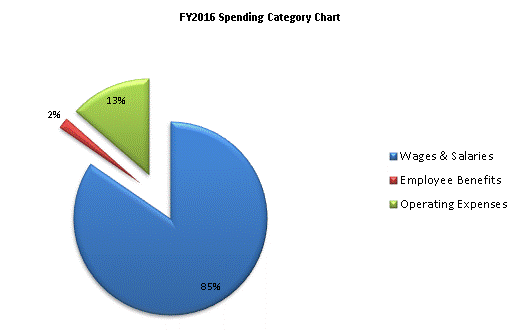
| Wages & Salaries | 16,612 | 16,848 | 18,252 | 18,904 | 18,767 |
| Employee Benefits | 414 | 338 | 369 | 402 | 415 |
| Operating Expenses | 965 | 1,132 | 2,713 | 2,951 | 3,007 |
| TOTAL | 17,991 | 18,318 | 21,334 | 22,257 | 22,189 |
