| SPENDING CATEGORY |
FY2012 Expended |
FY2013 Expended |
FY2014 Expended |
FY2015 Projected Spending * |
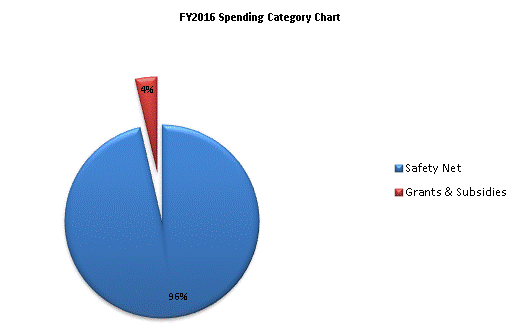
FY2016 House 1 |
|---|---|---|---|---|---|
| Operating Expenses | 0 | 0 | 31 | 0 | 0 |
| Safety Net | 216,584 | 205,560 | 211,295 | 233,400 | 243,926 |
| Grants & Subsidies | 9,003 | 8,904 | 8,329 | 9,019 | 9,019 |
| TOTAL | 225,588 | 214,464 | 219,655 | 242,419 | 252,945 |
