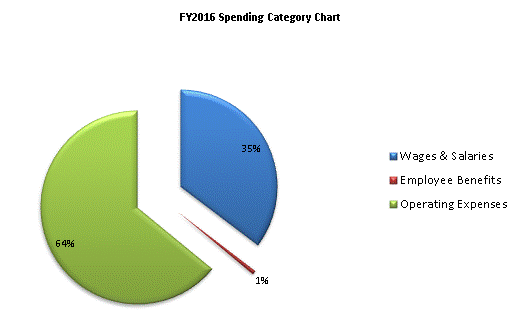
| SPENDING CATEGORY |
FY2012 Expended |
FY2013 Expended |
FY2014 Expended |
FY2015 Projected Spending * |
FY2016 House 1 |
|---|---|---|---|---|---|
| Wages & Salaries | 1,909 | 1,992 | 1,930 | 2,492 | 2,192 |
| Employee Benefits | 51 | 36 | 33 | 46 | 41 |
| Operating Expenses | 3,777 | 3,674 | 3,790 | 3,468 | 3,979 |
| Grants & Subsidies | 1,500 | 1,500 | 0 | 0 | 0 |
| TOTAL | 7,238 | 7,202 | 5,753 | 6,006 | 6,212 |
