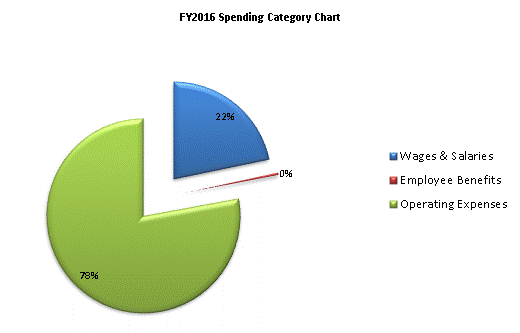
| SPENDING CATEGORY |
FY2012 Expended |
FY2013 Expended |
FY2014 Expended |
FY2015 Projected Spending * |
FY2016 House 1 |
|---|---|---|---|---|---|
| Wages & Salaries | 19,652 | 21,604 | 22,186 | 25,367 | 26,371 |
| Employee Benefits | 389 | 300 | 327 | 424 | 440 |
| Operating Expenses | 33,622 | 38,185 | 45,942 | 58,163 | 94,425 |
| TOTAL | 53,663 | 60,089 | 68,454 | 83,955 | 121,236 |
