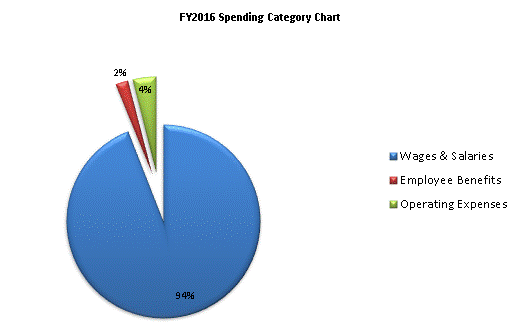
| SPENDING CATEGORY |
FY2012 Expended |
FY2013 Expended |
FY2014 Expended |
FY2015 Projected Spending * |
FY2016 House 1 |
|---|---|---|---|---|---|
| Wages & Salaries | 490 | 505 | 520 | 516 | 463 |
| Employee Benefits | 12 | 8 | 8 | 9 | 10 |
| Operating Expenses | 41 | 20 | 16 | 17 | 19 |
| TOTAL | 542 | 533 | 544 | 542 | 492 |
