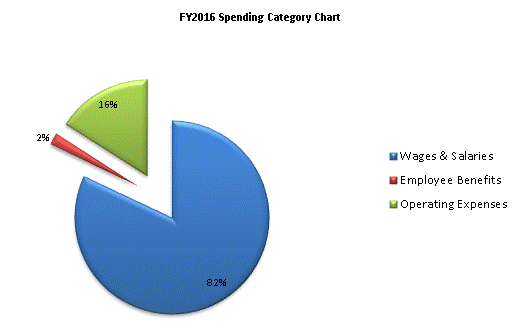
| SPENDING CATEGORY |
FY2012 Expended |
FY2013 Expended |
FY2014 Expended |
FY2015 Projected Spending * |
FY2016 House 1 |
|---|---|---|---|---|---|
| Wages & Salaries | 2,159 | 2,071 | 3,210 | 3,442 | 3,883 |
| Employee Benefits | 44 | 29 | 42 | 87 | 94 |
| Operating Expenses | 288 | 55 | 446 | 748 | 757 |
| TOTAL | 2,491 | 2,155 | 3,698 | 4,276 | 4,733 |
