1106-0064 - Caseload and Economic Forecasting Office
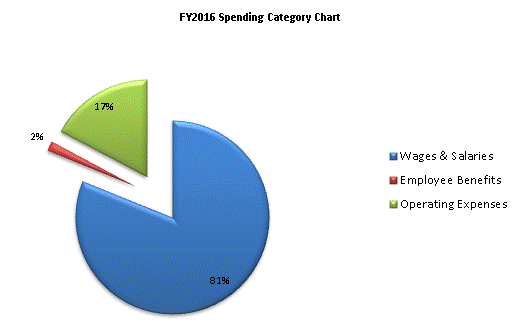
Historical Spending Categories ($000)
SPENDING CATEGORY
FY2012
Expended
FY2013
Expended
FY2014
Expended
FY2015
Projected
Spending *
FY2016
House 1
Wages & Salaries
47
109
300
128
106
Employee Benefits
1
2
2
2
2
Operating Expenses
10
7
0
0
23
TOTAL
57
118
303
130
130