| SPENDING CATEGORY |
FY2012 Expended |
FY2013 Expended |
FY2014 Expended |
FY2015 Projected Spending * |
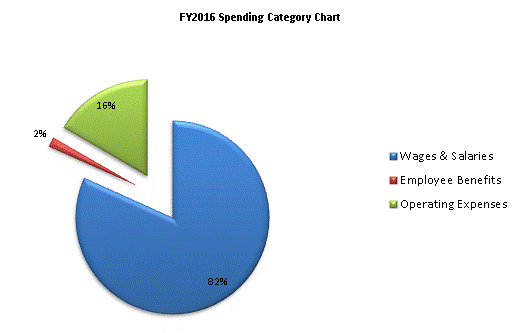
FY2016 House 1 |
|---|---|---|---|---|---|
| Wages & Salaries | 18,874 | 18,074 | 18,443 | 18,498 | 18,498 |
| Employee Benefits | 447 | 307 | 333 | 378 | 378 |
| Operating Expenses | 3,519 | 3,621 | 3,420 | 3,755 | 3,755 |
| TOTAL | 22,840 | 22,002 | 22,196 | 22,632 | 22,632 |
