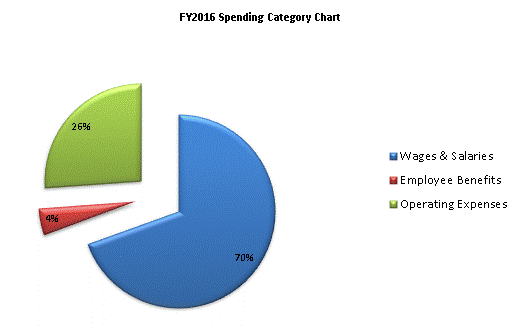
| SPENDING CATEGORY |
FY2012 Expended |
FY2013 Expended |
FY2014 Expended |
FY2015 Projected Spending * |
FY2016 House 1 |
|---|---|---|---|---|---|
| Wages & Salaries | 216 | 633 | 532 | 521 | 417 |
| Employee Benefits | 9 | 18 | 23 | 26 | 26 |
| Operating Expenses | 74 | 1,179 | 0 | 1,345 | 157 |
| TOTAL | 299 | 1,830 | 554 | 1,892 | 600 |
