| SPENDING CATEGORY |
FY2012 Expended |
FY2013 Expended |
FY2014 Expended |
FY2015 Projected Spending * |
FY2016 House 1 |
|---|---|---|---|---|---|
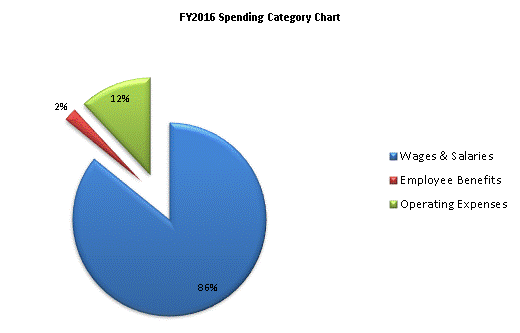
| Wages & Salaries | 5,327 | 5,003 | 5,117 | 5,239 | 5,239 |
| Employee Benefits | 139 | 100 | 118 | 133 | 133 |
| Operating Expenses | 427 | 705 | 689 | 732 | 732 |
| Grants & Subsidies | 0 | 58 | 5 | 0 | 0 |
| TOTAL | 5,893 | 5,865 | 5,930 | 6,104 | 6,104 |
