| SPENDING CATEGORY |
FY2012 Expended |
FY2013 Expended |
FY2014 Expended |
FY2015 Projected Spending * |
FY2016 House 1 |
|---|---|---|---|---|---|
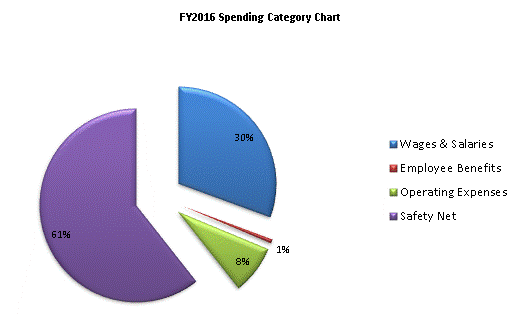
| Wages & Salaries | 9,938 | 9,752 | 9,799 | 6,158 | 6,158 |
| Employee Benefits | 228 | 158 | 167 | 135 | 135 |
| Operating Expenses | 2,770 | 2,831 | 2,605 | 1,628 | 1,628 |
| Safety Net | 8,104 | 7,405 | 7,541 | 12,201 | 12,201 |
| TOTAL | 21,040 | 20,146 | 20,112 | 20,122 | 20,122 |
