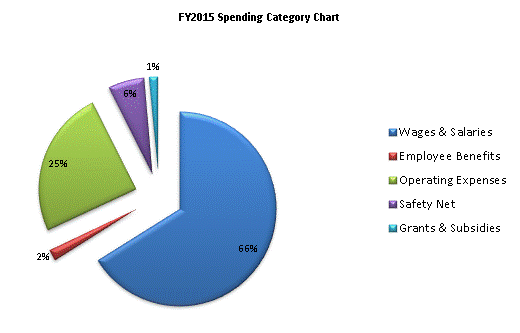
| SPENDING CATEGORY |
FY2011 Expended |
FY2012 Expended |
FY2013 Expended |
FY2014 Projected Spending * |
FY2015 House 2 |
|---|---|---|---|---|---|
| Wages & Salaries | 126,113 | 123,883 | 135,579 | 146,455 | 151,957 |
| Employee Benefits | 4,245 | 4,299 | 3,859 | 4,189 | 4,354 |
| Operating Expenses | 42,548 | 44,976 | 46,321 | 52,083 | 56,466 |
| Safety Net | 11,427 | 11,311 | 12,801 | 13,795 | 13,887 |
| Grants & Subsidies | 741 | 3,064 | 2,975 | 3,990 | 3,083 |
| TOTAL | 185,074 | 187,532 | 201,535 | 220,512 | 229,747 |
