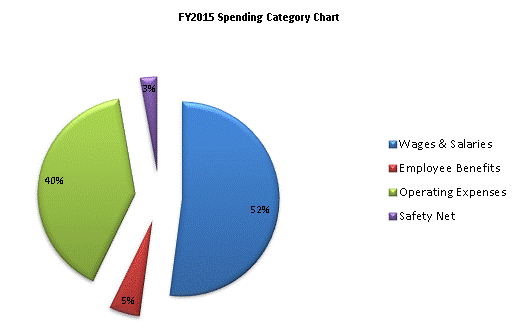
| SPENDING CATEGORY |
FY2011 Expended |
FY2012 Expended |
FY2013 Expended |
FY2014 Projected Spending * |
FY2015 House 2 |
|---|---|---|---|---|---|
| Wages & Salaries | 2,038 | 1,961 | 2,092 | 634 | 4,401 |
| Employee Benefits | 34 | 31 | 22 | 430 | 430 |
| Operating Expenses | 5,427 | 5,734 | 5,794 | 7,242 | 3,397 |
| Safety Net | 0 | 0 | 0 | 329 | 228 |
| TOTAL | 7,499 | 7,727 | 7,909 | 8,636 | 8,456 |
