| SPENDING CATEGORY |
FY2011 Expended |
FY2012 Expended |
FY2013 Expended |
FY2014 Projected Spending * |
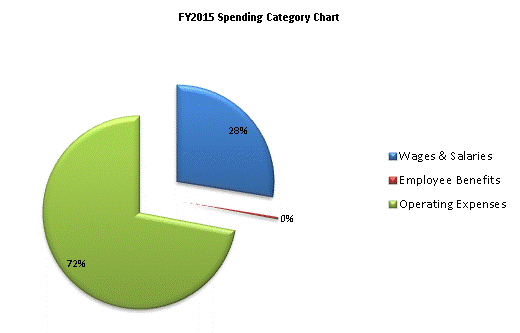
FY2015 House 2 |
|---|---|---|---|---|---|
| Wages & Salaries | 3,669 | 3,187 | 3,325 | 3,481 | 3,607 |
| Employee Benefits | 70 | 62 | 44 | 51 | 51 |
| Operating Expenses | 249 | 169 | 383 | 3,731 | 9,427 |
| TOTAL | 3,988 | 3,419 | 3,752 | 7,263 | 13,085 |
