| SPENDING CATEGORY |
FY2011 Expended |
FY2012 Expended |
FY2013 Expended |
FY2014 Projected Spending * |
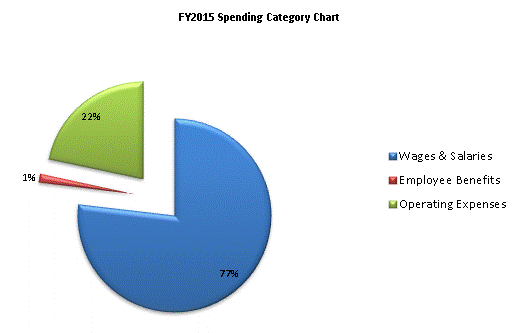
FY2015 House 2 |
|---|---|---|---|---|---|
| Wages & Salaries | 39,584 | 36,050 | 41,455 | 45,373 | 46,891 |
| Employee Benefits | 863 | 809 | 666 | 821 | 870 |
| Operating Expenses | 7,581 | 7,932 | 8,081 | 9,787 | 13,251 |
| Grants & Subsidies | 0 | 150 | 0 | 482 | 0 |
| TOTAL | 48,028 | 44,941 | 50,203 | 56,463 | 61,013 |
