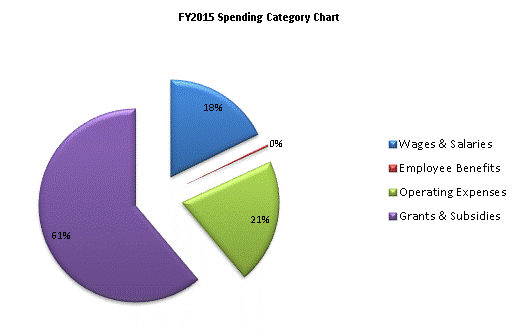
| SPENDING CATEGORY |
FY2011 Expended |
FY2012 Expended |
FY2013 Expended |
FY2014 Projected Spending * |
FY2015 House 2 |
|---|---|---|---|---|---|
| Wages & Salaries | 1,476 | 1,561 | 1,643 | 1,664 | 1,738 |
| Employee Benefits | 35 | 34 | 30 | 33 | 34 |
| Operating Expenses | 917 | 915 | 1,530 | 1,793 | 2,032 |
| Grants & Subsidies | 0 | 0 | 1,312 | 44,390 | 5,977 |
| TOTAL | 2,427 | 2,510 | 4,516 | 47,880 | 9,780 |