| SPENDING CATEGORY |
FY2011 Expended |
FY2012 Expended |
FY2013 Expended |
FY2014 Projected Spending * |
FY2015 House 2 |
|---|---|---|---|---|---|
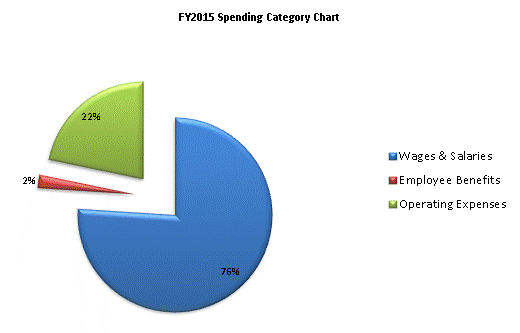
| Wages & Salaries | 6,261 | 6,528 | 7,164 | 8,888 | 9,477 |
| Employee Benefits | 255 | 241 | 239 | 268 | 275 |
| Operating Expenses | 2,021 | 2,540 | 2,318 | 2,370 | 2,715 |
| Grants & Subsidies | 0 | 84 | 0 | 0 | 0 |
| TOTAL | 8,537 | 9,395 | 9,721 | 11,526 | 12,467 |
