| SPENDING CATEGORY |
FY2011 Expended |
FY2012 Expended |
FY2013 Expended |
FY2014 Projected Spending * |
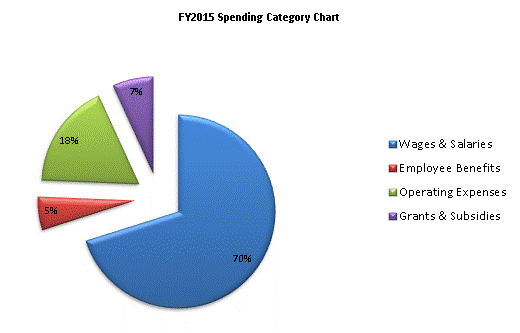
FY2015 House 2 |
|---|---|---|---|---|---|
| Wages & Salaries | 9,993 | 10,091 | 10,382 | 13,028 | 13,350 |
| Employee Benefits | 967 | 1,046 | 980 | 1,049 | 1,052 |
| Operating Expenses | 3,027 | 3,554 | 3,124 | 3,328 | 3,338 |
| Grants & Subsidies | 1,000 | 900 | 1,300 | 1,300 | 1,300 |
| TOTAL | 14,987 | 15,591 | 15,786 | 18,705 | 19,040 |
