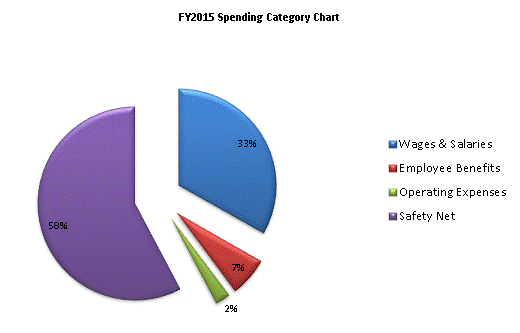
| SPENDING CATEGORY |
FY2011 Expended |
FY2012 Expended |
FY2013 Expended |
FY2014 Projected Spending * |
FY2015 House 2 |
|---|---|---|---|---|---|
| Wages & Salaries | 31,612 | 31,424 | 31,178 | 1,259 | 12,990 |
| Employee Benefits | 1,186 | 1,124 | 890 | 2,560 | 2,558 |
| Operating Expenses | 459 | 272 | 362 | 17,132 | 989 |
| Safety Net | 0 | 0 | 0 | 22,568 | 22,568 |
| TOTAL | 33,256 | 32,821 | 32,430 | 43,519 | 39,104 |