| SPENDING CATEGORY |
FY2011 Expended |
FY2012 Expended |
FY2013 Expended |
FY2014 Projected Spending * |
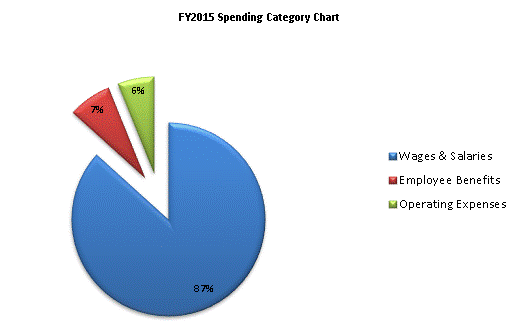
FY2015 House 2 |
|---|---|---|---|---|---|
| Wages & Salaries | 15,863 | 16,162 | 16,090 | 13,993 | 16,578 |
| Employee Benefits | 417 | 412 | 310 | 1,372 | 1,372 |
| Operating Expenses | 579 | 544 | 506 | 4,861 | 1,171 |
| TOTAL | 16,859 | 17,118 | 16,906 | 20,226 | 19,121 |
